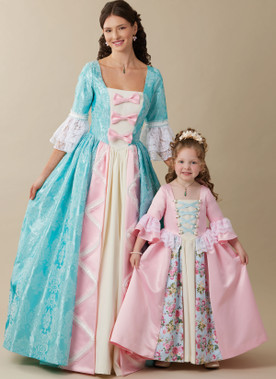
M8549 (PDF) McCall's Sewing Pattern Children's and Misses' Princess Costume (PDF) $14.67 A0 Print Size
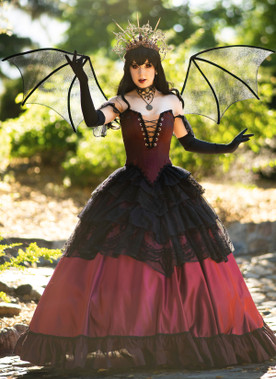
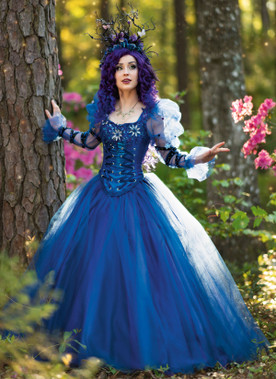
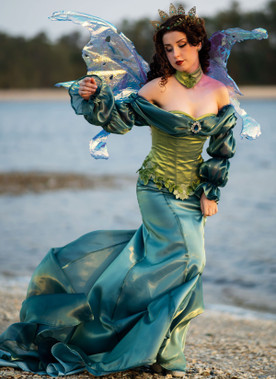
S3063 (PDF) Simplicity Sewing Pattern Misses' Corset and Skirt Costume by Raine Emery (PDF) (2) $16.77 A0 Print Size
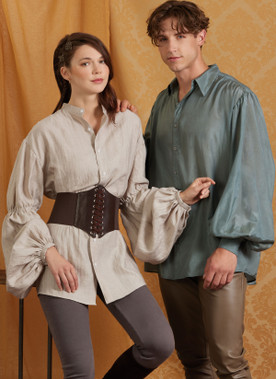
S3062 (PDF) Simplicity Sewing Pattern Unisex Costume Shirts by Scissor IMP Workshop (PDF) $16.77 A0 Print Size